Research note · October 18, 2026
The galaxy, version 2: what changed
The Topic Galaxy is now a 3D map with 2,499 clusters, rewritten names, similar-object lines, a phone layout, light and dark themes and eight interface languages. What changed from version 1.
linkedculturegalaxysemanticclusteringvisualizationculturalheritagemultilingual
The Topic Galaxy maps 525,298 museum records from nine institutions. Each dot is a record. Records whose catalog text reads alike are grouped into clusters, and related clusters sit near each other. Version 1 went live in June as a flat map. On October 18 it was replaced, at the same address, by a 3D version built from the same embeddings and a rebuilt clustering. If you work with a collection, this note is also a record of what a text-only clustering got right and wrong when it was pointed at nine catalogs. It lists what changed.
Version 1
Version 1 was a flat map. Clusters were circles, and a click opened a panel with a description and a strip of images. Its header read 525,298 objects and 2,627 clusters.
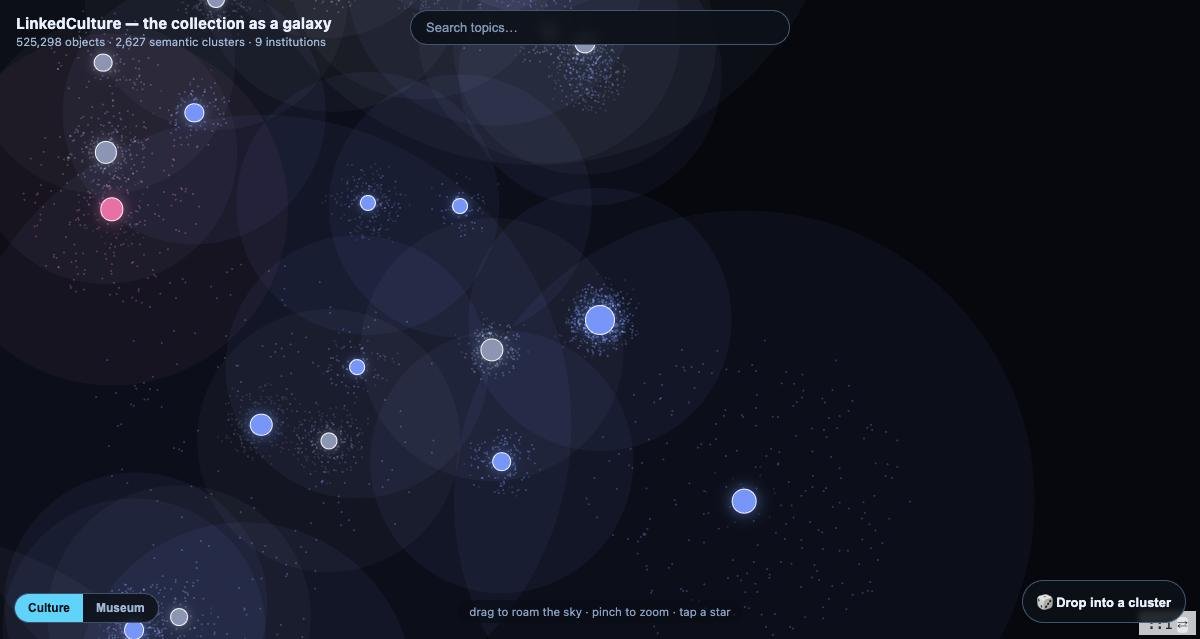
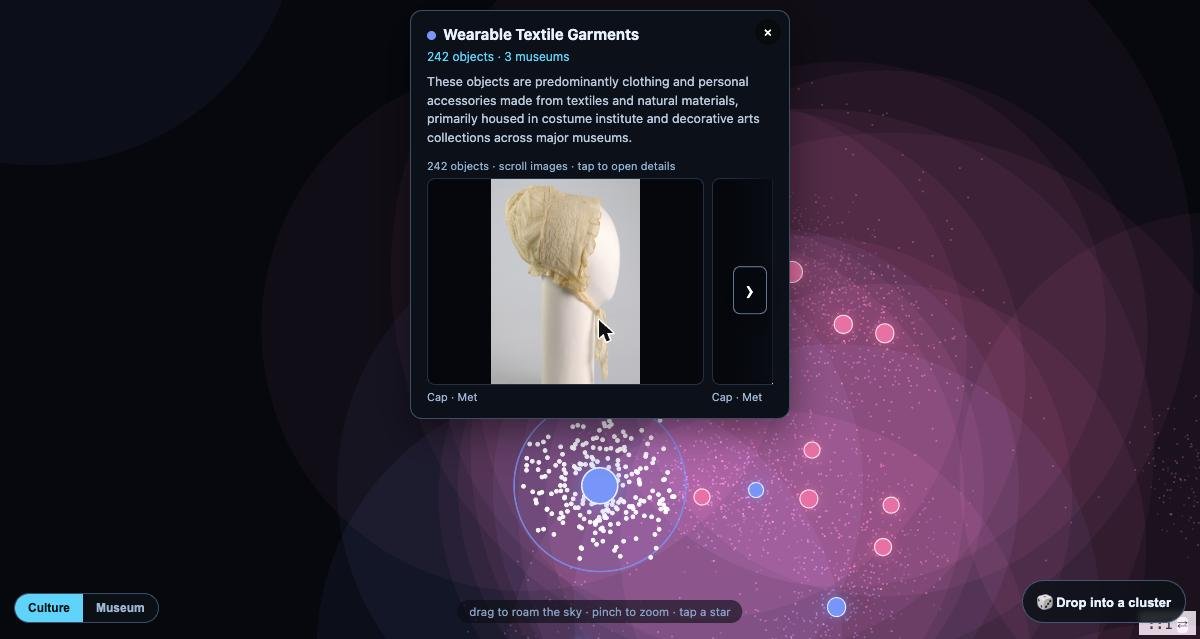
The cluster names were written one cluster at a time. A language model saw 20 sampled records from a cluster and nothing about the clusters around it, so neighboring clusters often got the same name. One name, "Classical Attic Kylix Fragments", was used 15 times.
Version 2
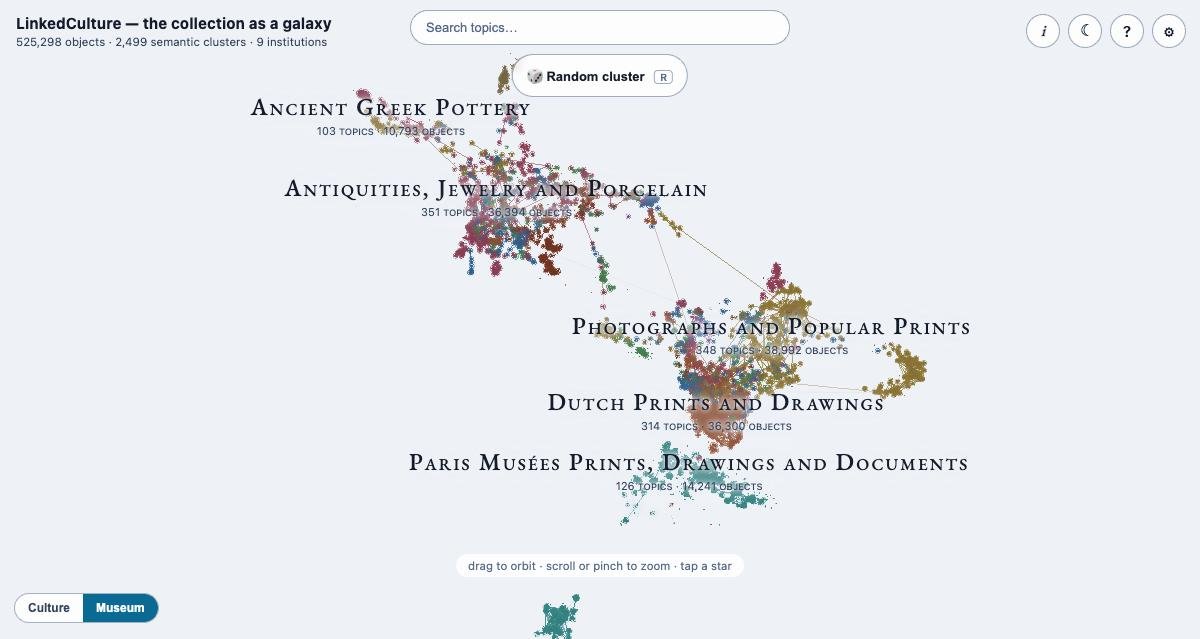
A 3D map
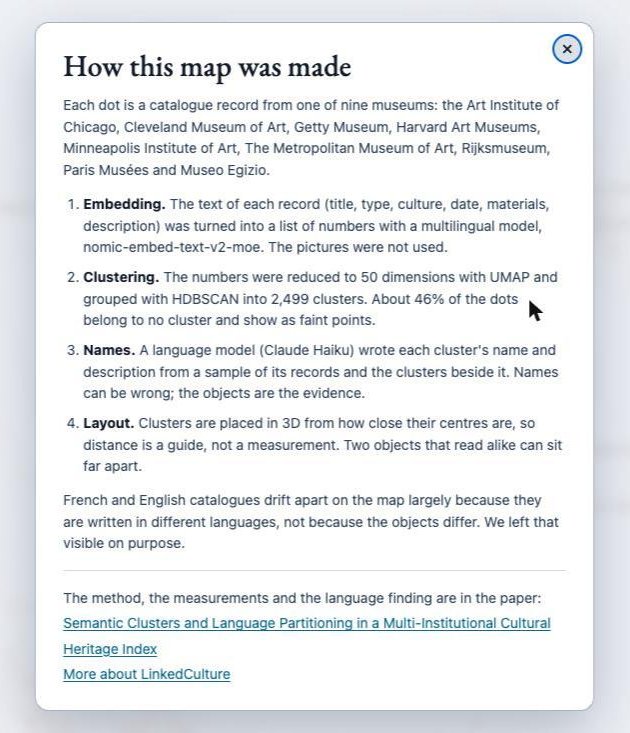
The map now has real depth. You can orbit it, zoom from the whole collection down to a single cluster, and the dots turn into the objects' photos as you get close. The 3D positions come from a separate layout of the cluster centers, so distance on the map is a guide to similarity and not a measurement. The how-it-was-made popup (the i button) says so.
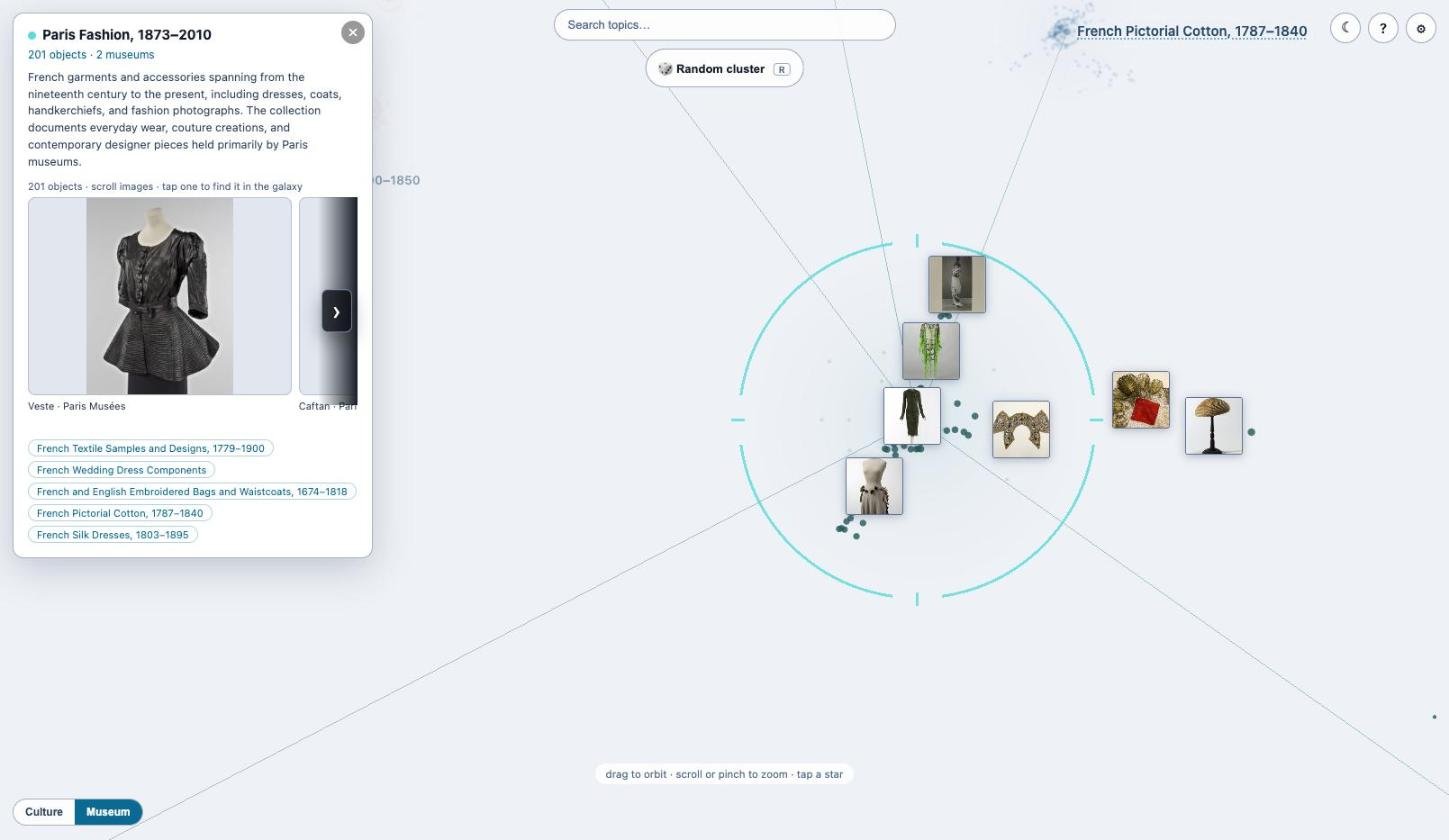
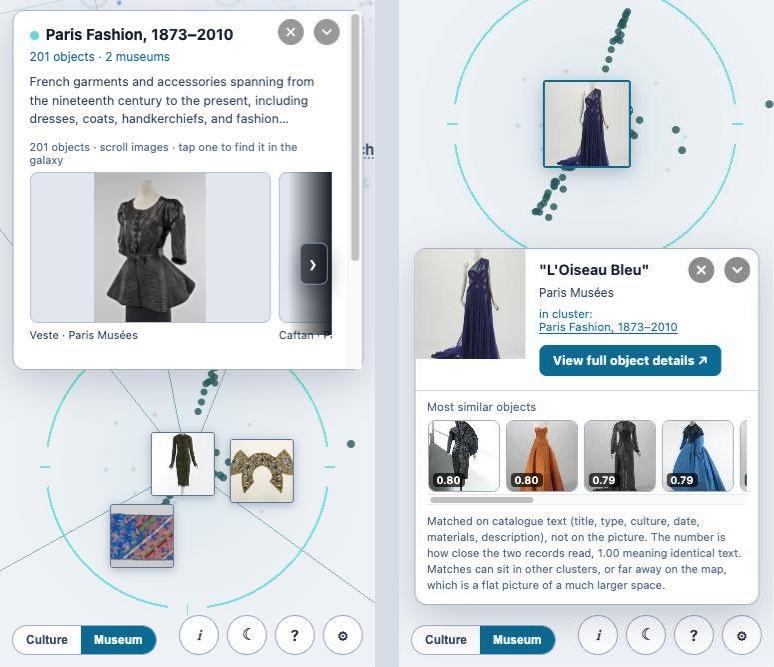
Cluster 487 is a good example. It holds 201 objects from two museums, mostly dresses, coats and accessories. The images in the panel's slider are the cluster's members, so you can check a name against what it describes before you trust it. Tapping one moves the camera to that object on the map and opens its card. The link to the full object page is on the card.
Fewer, better-separated clusters
The earlier clustering had split some themes into several near-identical clusters. I merged clusters whose centers were nearly identical (cosine similarity of 0.98 or more) and whose names overlapped. A merge only happens if every cluster in the group meets the threshold against every other one, because a chain of near matches had once joined 48 kylix clusters into one. That merged 128 clusters, taking 2,694 to 2,566. A further 67 clusters are not shown on the map, so it now has 2,499 clusters.
Names and descriptions rewritten
Every cluster name and description was rewritten by Claude Haiku 4.5. This time the model saw a sample of the cluster's records, the makers, cultures and object types counted across the cluster, and the names of the six nearest clusters, with an instruction to differ from them. No name is used twice now. Some names also got more accurate. A cluster called "Joseph Pennell's printmaking practice" is now a Whistler lithograph cluster, because 407 of its 430 objects are by Whistler. The 15 kylix clusters now say what separates them, for example "Attic Kylix Body Fragments, 530 to 450 BCE".
The 16 region names, shown when zoomed out, had the same problem. I checked each against its contents and renamed 14. One region was called "Decorative Arts and Prints", and all 15,122 of its objects come from the Minneapolis Institute of Art. It is now "Minneapolis Institute of Art Mixed Collection", because it is a museum grouping and not a subject.
Similar objects
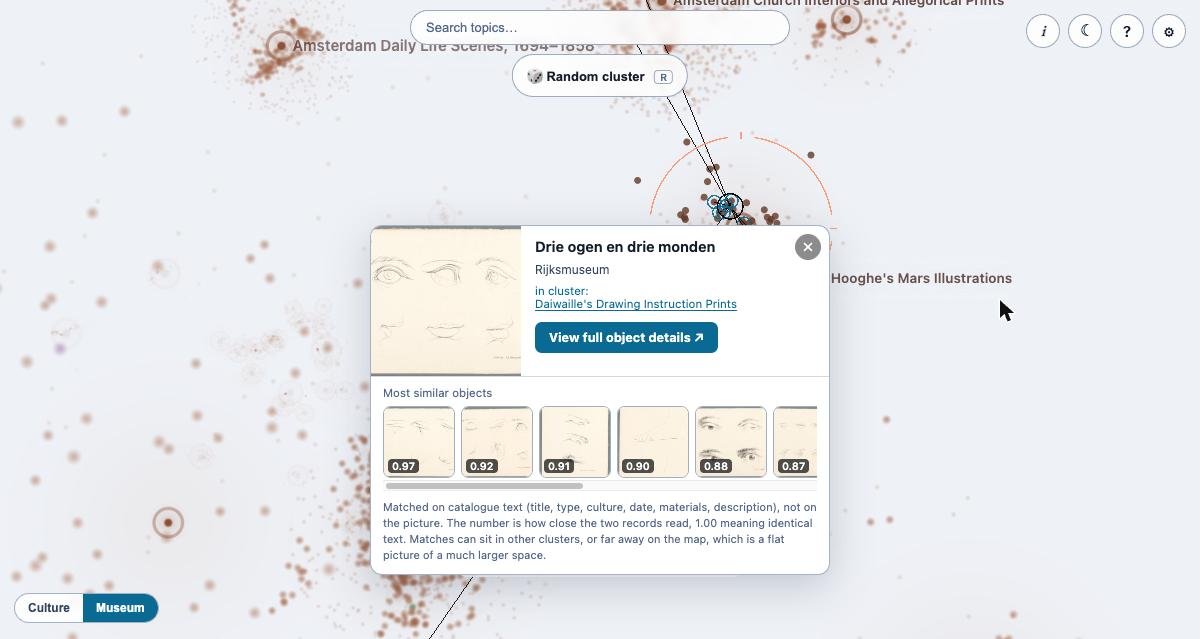
Opening an object shows its twelve most similar records, with scores, and draws lines on the map to where each one sits. The match is made on catalog text (title, type, culture, date, materials, description) and not on the picture. A note on the card says so. If you want to see how your own records read to a machine, open one you know well and look at the twelve matches. Where a match surprises you, compare the two records' wording first, because the text is what the model saw. About 46% of dots belong to no cluster, and when you open one of these objects the card lists its closest clusters. Objects that sit between two clusters show "also fits" links to the second one.
Moving around
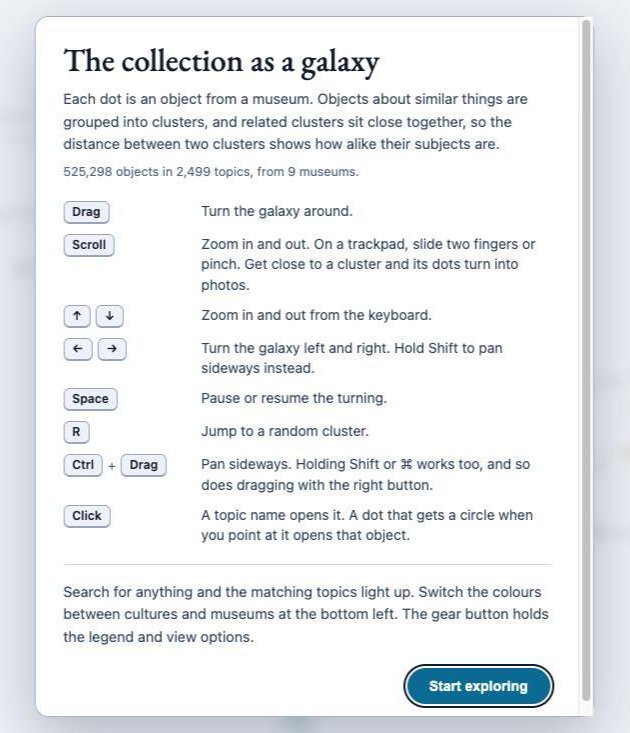
Once you are in, the arrow keys zoom (up and down) and turn the galaxy (left and right). Shift with left or right pans. Space pauses the turning, and R jumps to a random cluster. A refresh opens the whole galaxy, and a #cluster= link opens that cluster.
Light and dark, and phones
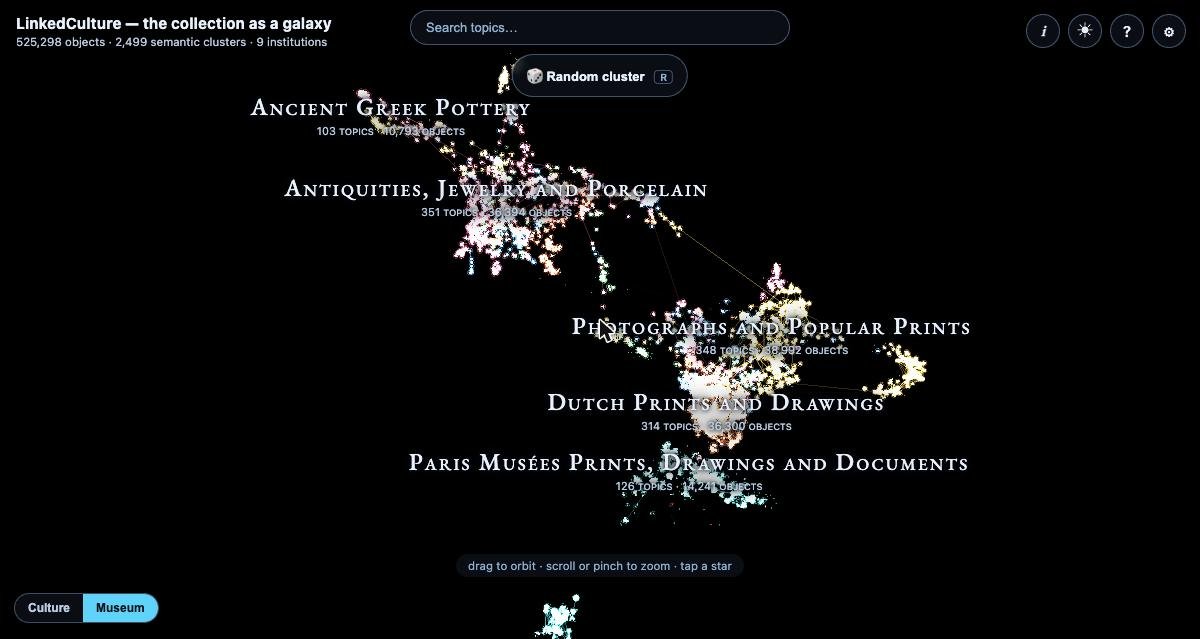
The page follows your system's light or dark setting and has a toggle for it, so you can switch it yourself. On a phone, the buttons sit along the bottom, and the cluster and object panels collapse to a header bar instead of closing, so the thing you selected stays selected.
Interface languages
The interface text now follows your browser's language: English, French, Spanish, German, Italian, Portuguese, Dutch and Norwegian (bokmål). If your browser asks for none of these, you get English. You can change it with the language selector at the bottom of the ⚙ panel, or by adding ?lang=fr (or es, de, it, pt, nl, nb) to the address. It covers the welcome panel, the how-it-was-made popup, the buttons, the options and the similarity note on the object card.
The data stays as it was written. Cluster names, region names and museum records are not translated, and the paper linked from the popup is in English. The translations were machine-written and have not had a native-speaker review yet, so if you read one of these languages and a line reads wrong, I would like to hear about it.
Speed
The thumbnails were loading museum images at full size. One Rijksmuseum image I measured was 3,164,831 bytes at 3,858 pixels wide, and the same image at 160 pixels is 6,499 bytes. There is now one function in the LinkedCulture code that asks each museum for an image of the right size (Rijksmuseum, Getty, the Met, Minneapolis and Harvard), and the galaxy uses it.
One object, one cluster: the blue bird dress
The dress that started Paper 3 is in cluster 487. It is a Jean Paul Gaultier gown at the Palais Galliera titled L'Oiseau Bleu, and the story of how it exposed the language partition is in The Blue Bird probe. Its object page has the record.
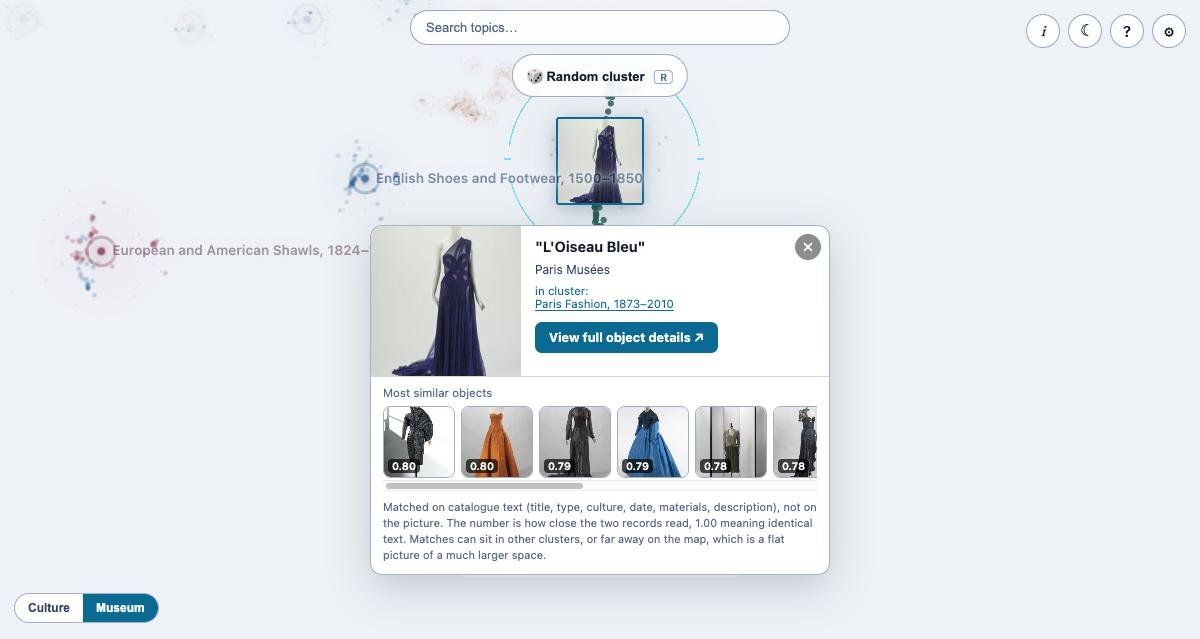
All twelve of its most similar records are from Paris Musées. The closest scores 0.80. The map shows the same result the paper measured: French-language records sit with other French-language records. I left that visible on purpose, and the i popup mentions it.
How it was made
The i button on the page opens a short account of the method (embedding, clustering, naming, layout) and links to the paper. In one paragraph: the text of each record was embedded with a multilingual model, reduced to 50 dimensions with UMAP, and clustered with HDBSCAN. Names were written by a language model from samples, and the 3D layout comes from the cluster centers. The paper has the measurements.
What is still rough
- Names are written by a model and can be wrong. If a name looks off to you, the slider shows the objects, and they are the evidence.
- About 46% of dots are not in any cluster.
- Similarity uses text only. Two objects that look alike can be far apart if their records read differently.
- The translations of the interface have not been reviewed by native speakers.
- The separate topic pages on LinkedCulture still use the earlier cluster names.
- Links to clusters that were merged away no longer open them, and cluster counts quoted in the papers come from earlier runs.
- Cleveland, Museo Egizio and Art Institute of Chicago images still load at full size, because those museums publish no smaller copy.
If you can spare five minutes, open galaxy.linkedculture.org, press R a few times, and tell me which clusters your own museum's records would land in. The method and the language finding are in Paper 3.
In this note
Papers cited
Records
1 object in the LinkedCulture index. Each page links on to the holding museum.